Answer to question a :
Choice of C hart will be the appropriate control chart to monitor this process.
C chart is used when counting total count of defects ( here that is ‘complaints’) per unit ( here that is ‘week)and is appropriate when the sample size is uniform . Here sample size for each case is “Week” and hence has an uniform sample size.
In case sample size was not uniform , c chart could not have been used and instead u chart would have been used.
Answer to question b :
Let , Cbar = Average number of complaints per week
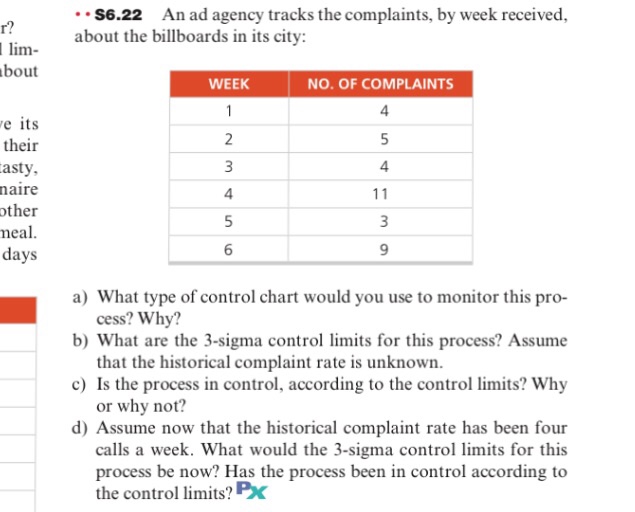
Therefore, Cbar = ( 4 + 5 + 4 + 11 + 3 + 9) / 6 = 6
Thus 3 sigma control limits are :
Upper Control Limit ( UCL )
= Cbar + 3 x square root ( Cbar)
= 6 + 3x square root ( 6)
= 6 + 3 x 2.45
UPP
= 13.35
Centerline ( CL) =Cbar = 6
Lower control Limit ( LCL)
= Cbar – 3 x square root ( Cbar)
= 6 – 3 x 2.45
= 6 – 7.35
= – 1.35
However since derived result for CL is negative number, we must consider LCL = 0
| 3 SIGMA UPPER CONTROL LIMIT ( UCL ) = 13.35 |
| CENTERLINE = 6 |
| 3 SIGMA LOWER CONTROL LIMIT ( LCL) = 0 |
Answer to question c:
The data on number of complaints are : 4. 5, 4 , 11, 3 and 9 . It can be seen that all these data are within UCL of 13.35 and LCL of 0 . Therefore, it can be concluded that the process is in control.
Answer to question 4 :
Now the historical complaint rate = 4 calls a week
Therefore ,
C bar = Average of all historical complaint rates each of which is 4 = 4
Therefore,
3 Sigma Upper Control Limit ( UCL )
= Cbar + 3x Square root ( Cbar)
= 4 + 3 x Square root( 4)
= 4 + 6
= 10
Centerline = Cbar = 4
3 sigma Lower control Limit
= Cbar – 3 x Square root ( Cbar )
= 4 – 3 x 2
= 4 – 6
= – 2
However since LCL cannot be a negative number, we shall consider LCL = 0
Thus :
| Upper Control Limit = 10 |
| Center Line = 4 |
| Lower Control Limit = 0 |
It is to be noted that there is complaint data e.g 11 which is > UCL . Therefore it can be concluded that the process is out of control.
Related: Statistical Quality Control
Check out the new sample created by our experienced operation management specialists. The sample that gives you a quality management problem solved can help you deal with your own assignment or simply inspire you to work harder and find the solution to your task. We also advise you to check other samples at our blog, for example, one of the program management examples, since you never know which one will help you to solve the task or inspire you to try a little bit harder. Don’t worry, however, if you still have no idea how to do this task – you have a team of professionals to help you.
All you need to do is fill in the order form in the upper right corner and upload the files that are crucial for your assignment. Also, don’t forget to specify whether your assignment has to be based upon a specific research, theory or method. After that, you will be asked to choose an expert you liked the most from those who have placed their bids under your order. You can always chat with your expert and ask any questions you have during the working process, and you will be asked to pay only after you receive a maximum subarray problem solved the way you needed it to be solved.
Tags: an ad agency tracks the complaints, by week received, about the billboards in its city: